In the Edgee Console
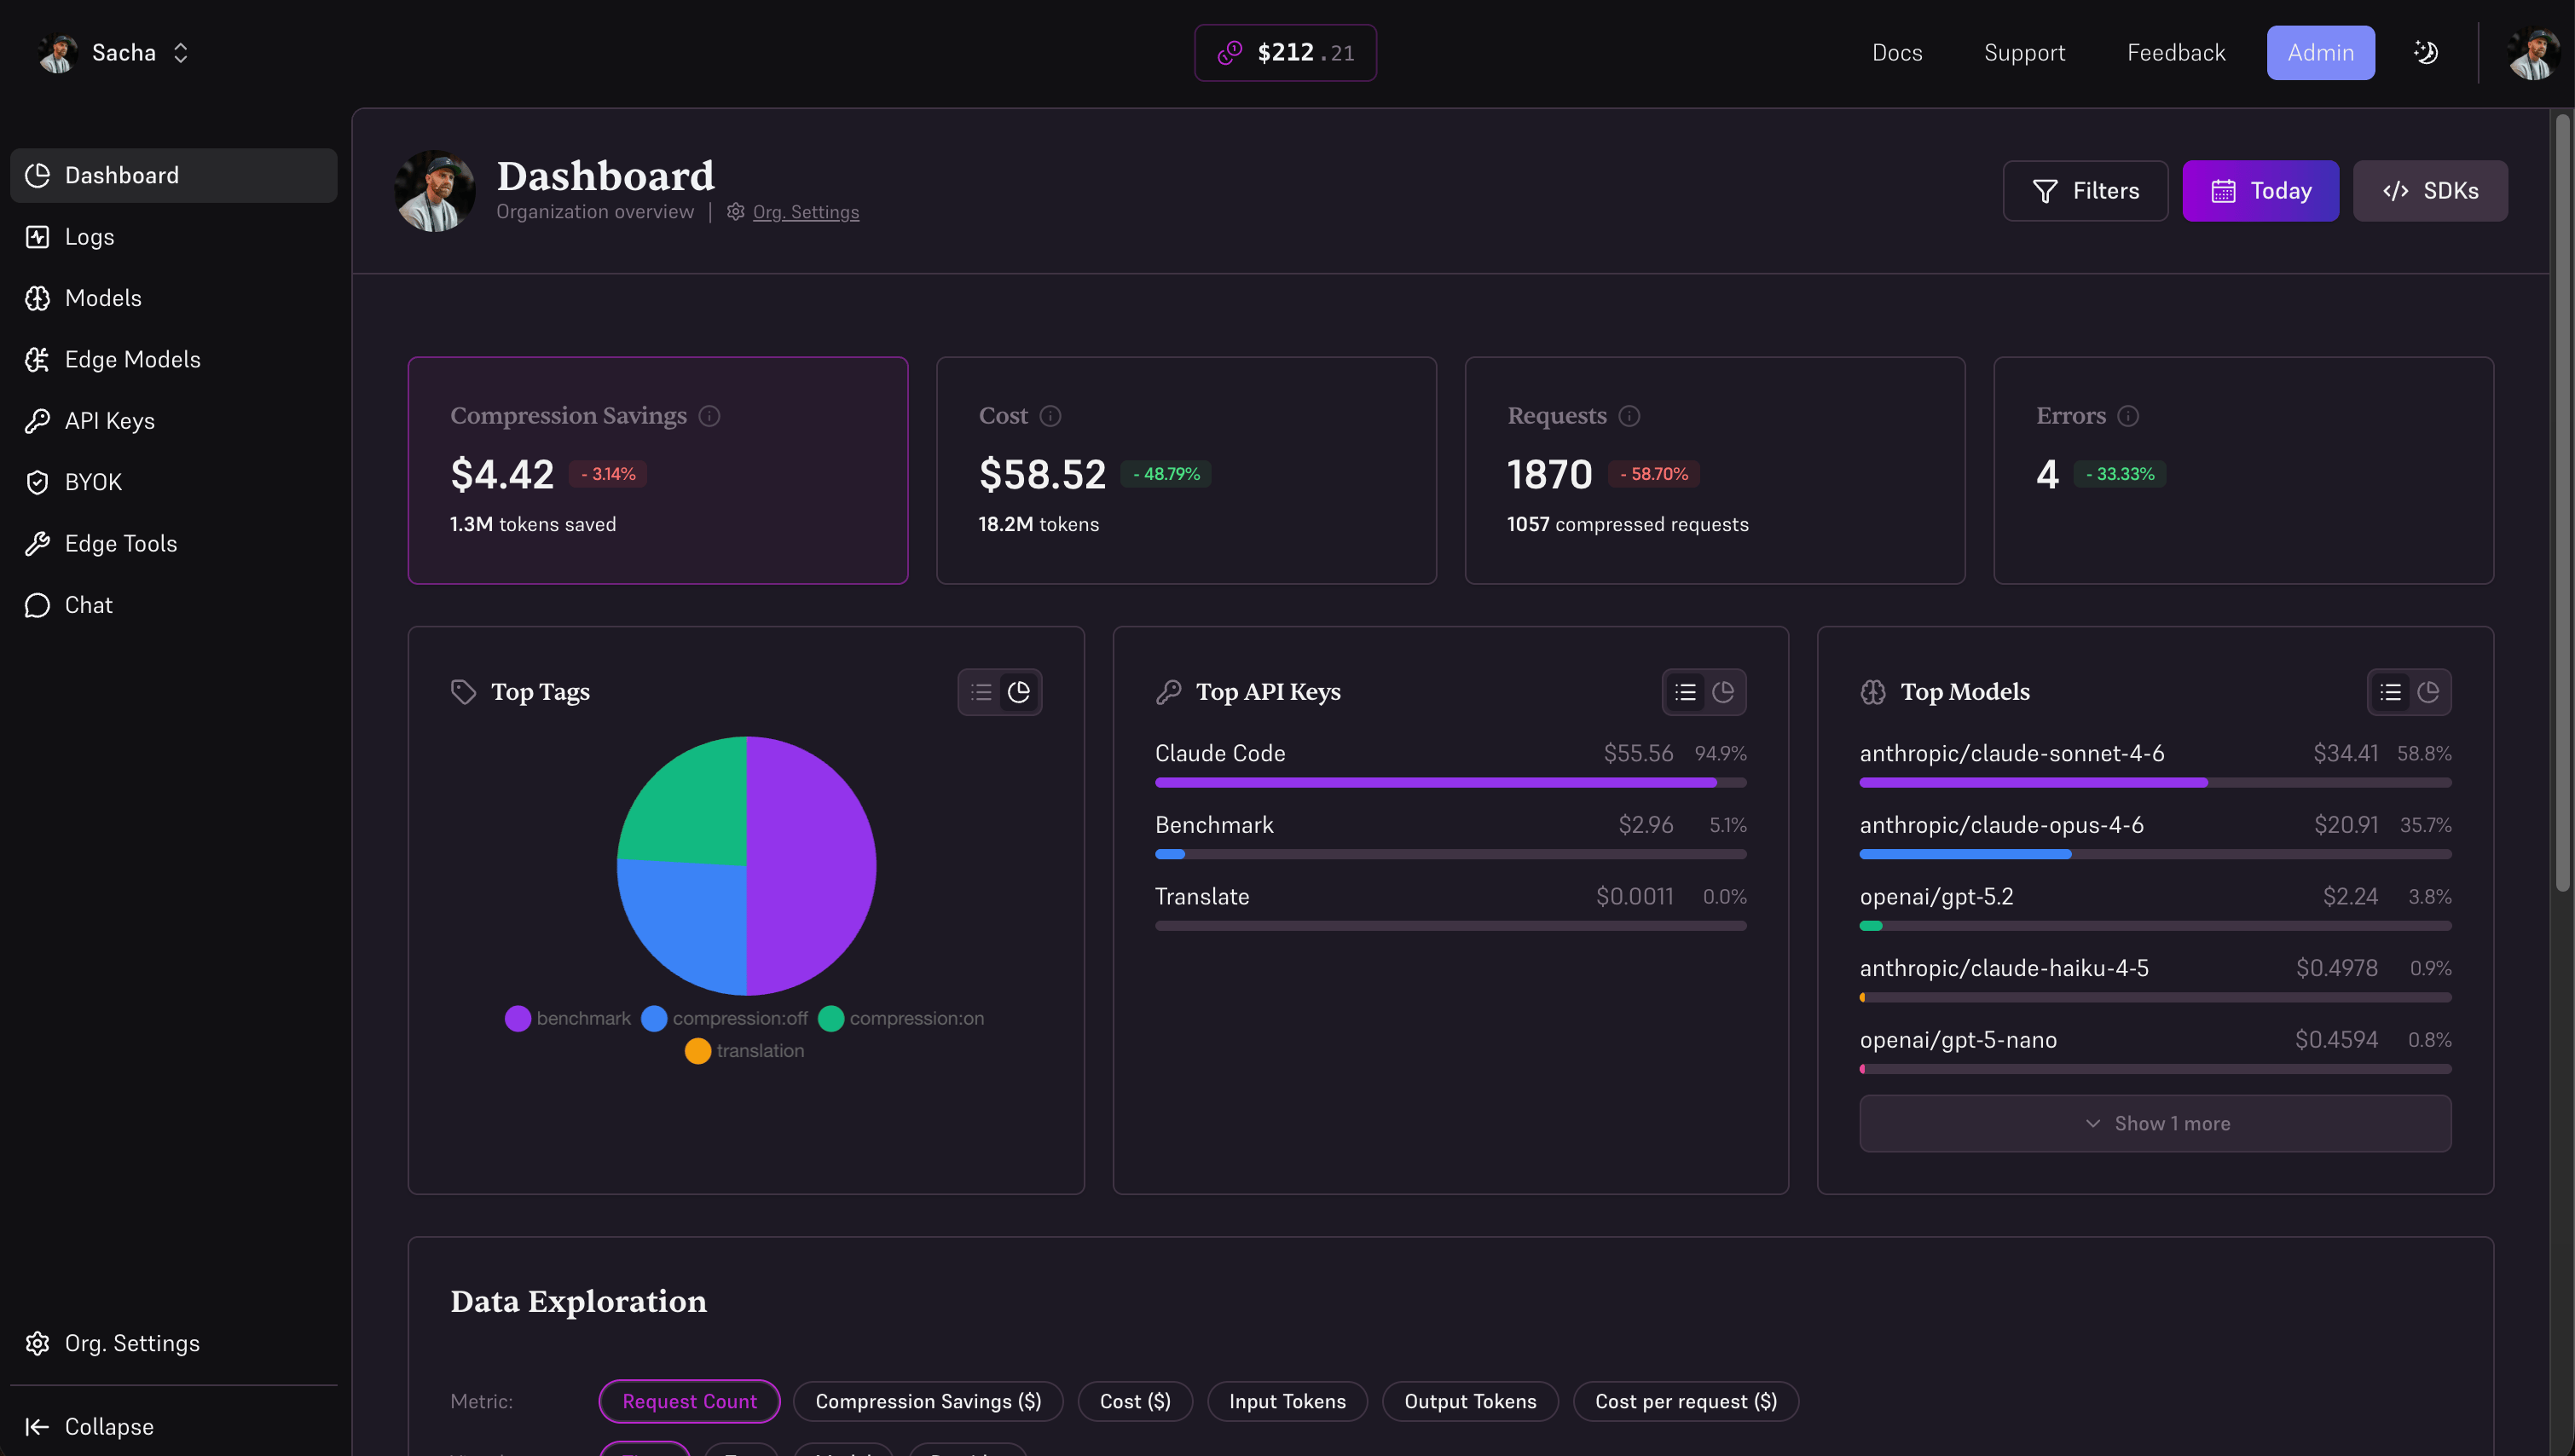
The Edgee Console aggregates costs, token usage, compression savings, performance, and errors across every request that flows through the gateway.Dashboard
The dashboard regroups everything in one place: costs, token usage, compression savings, performance, and errors.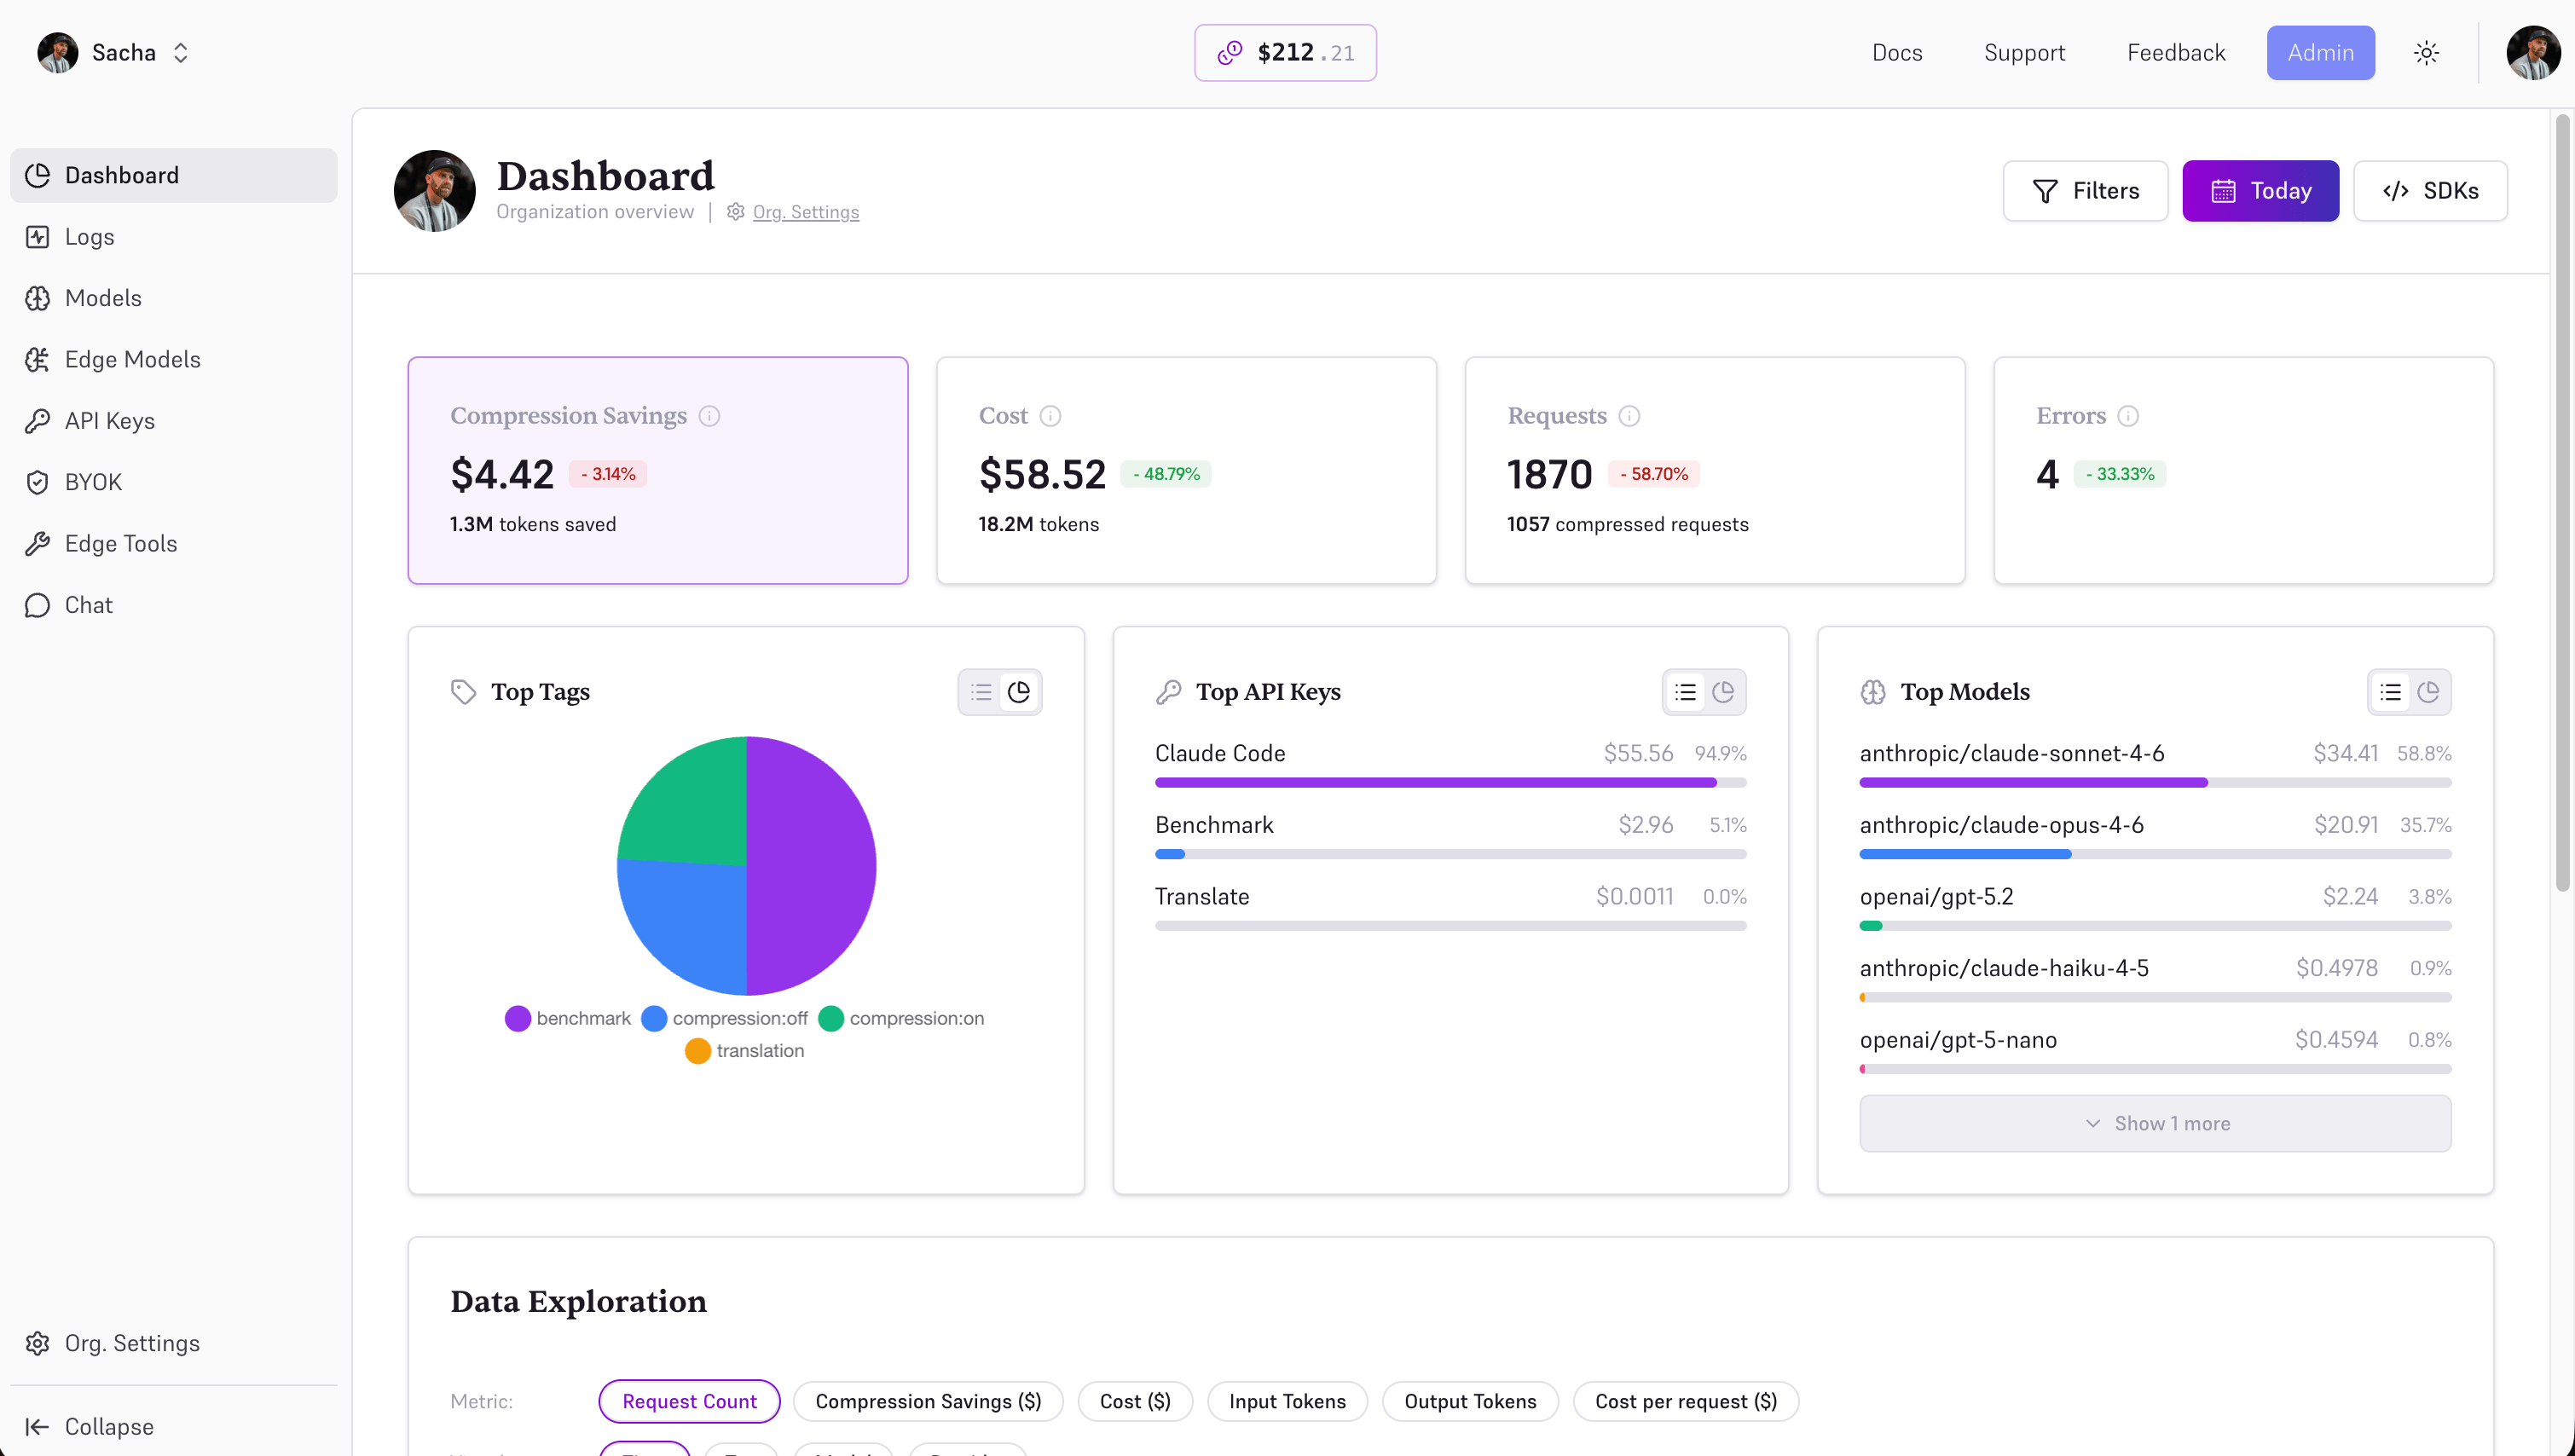
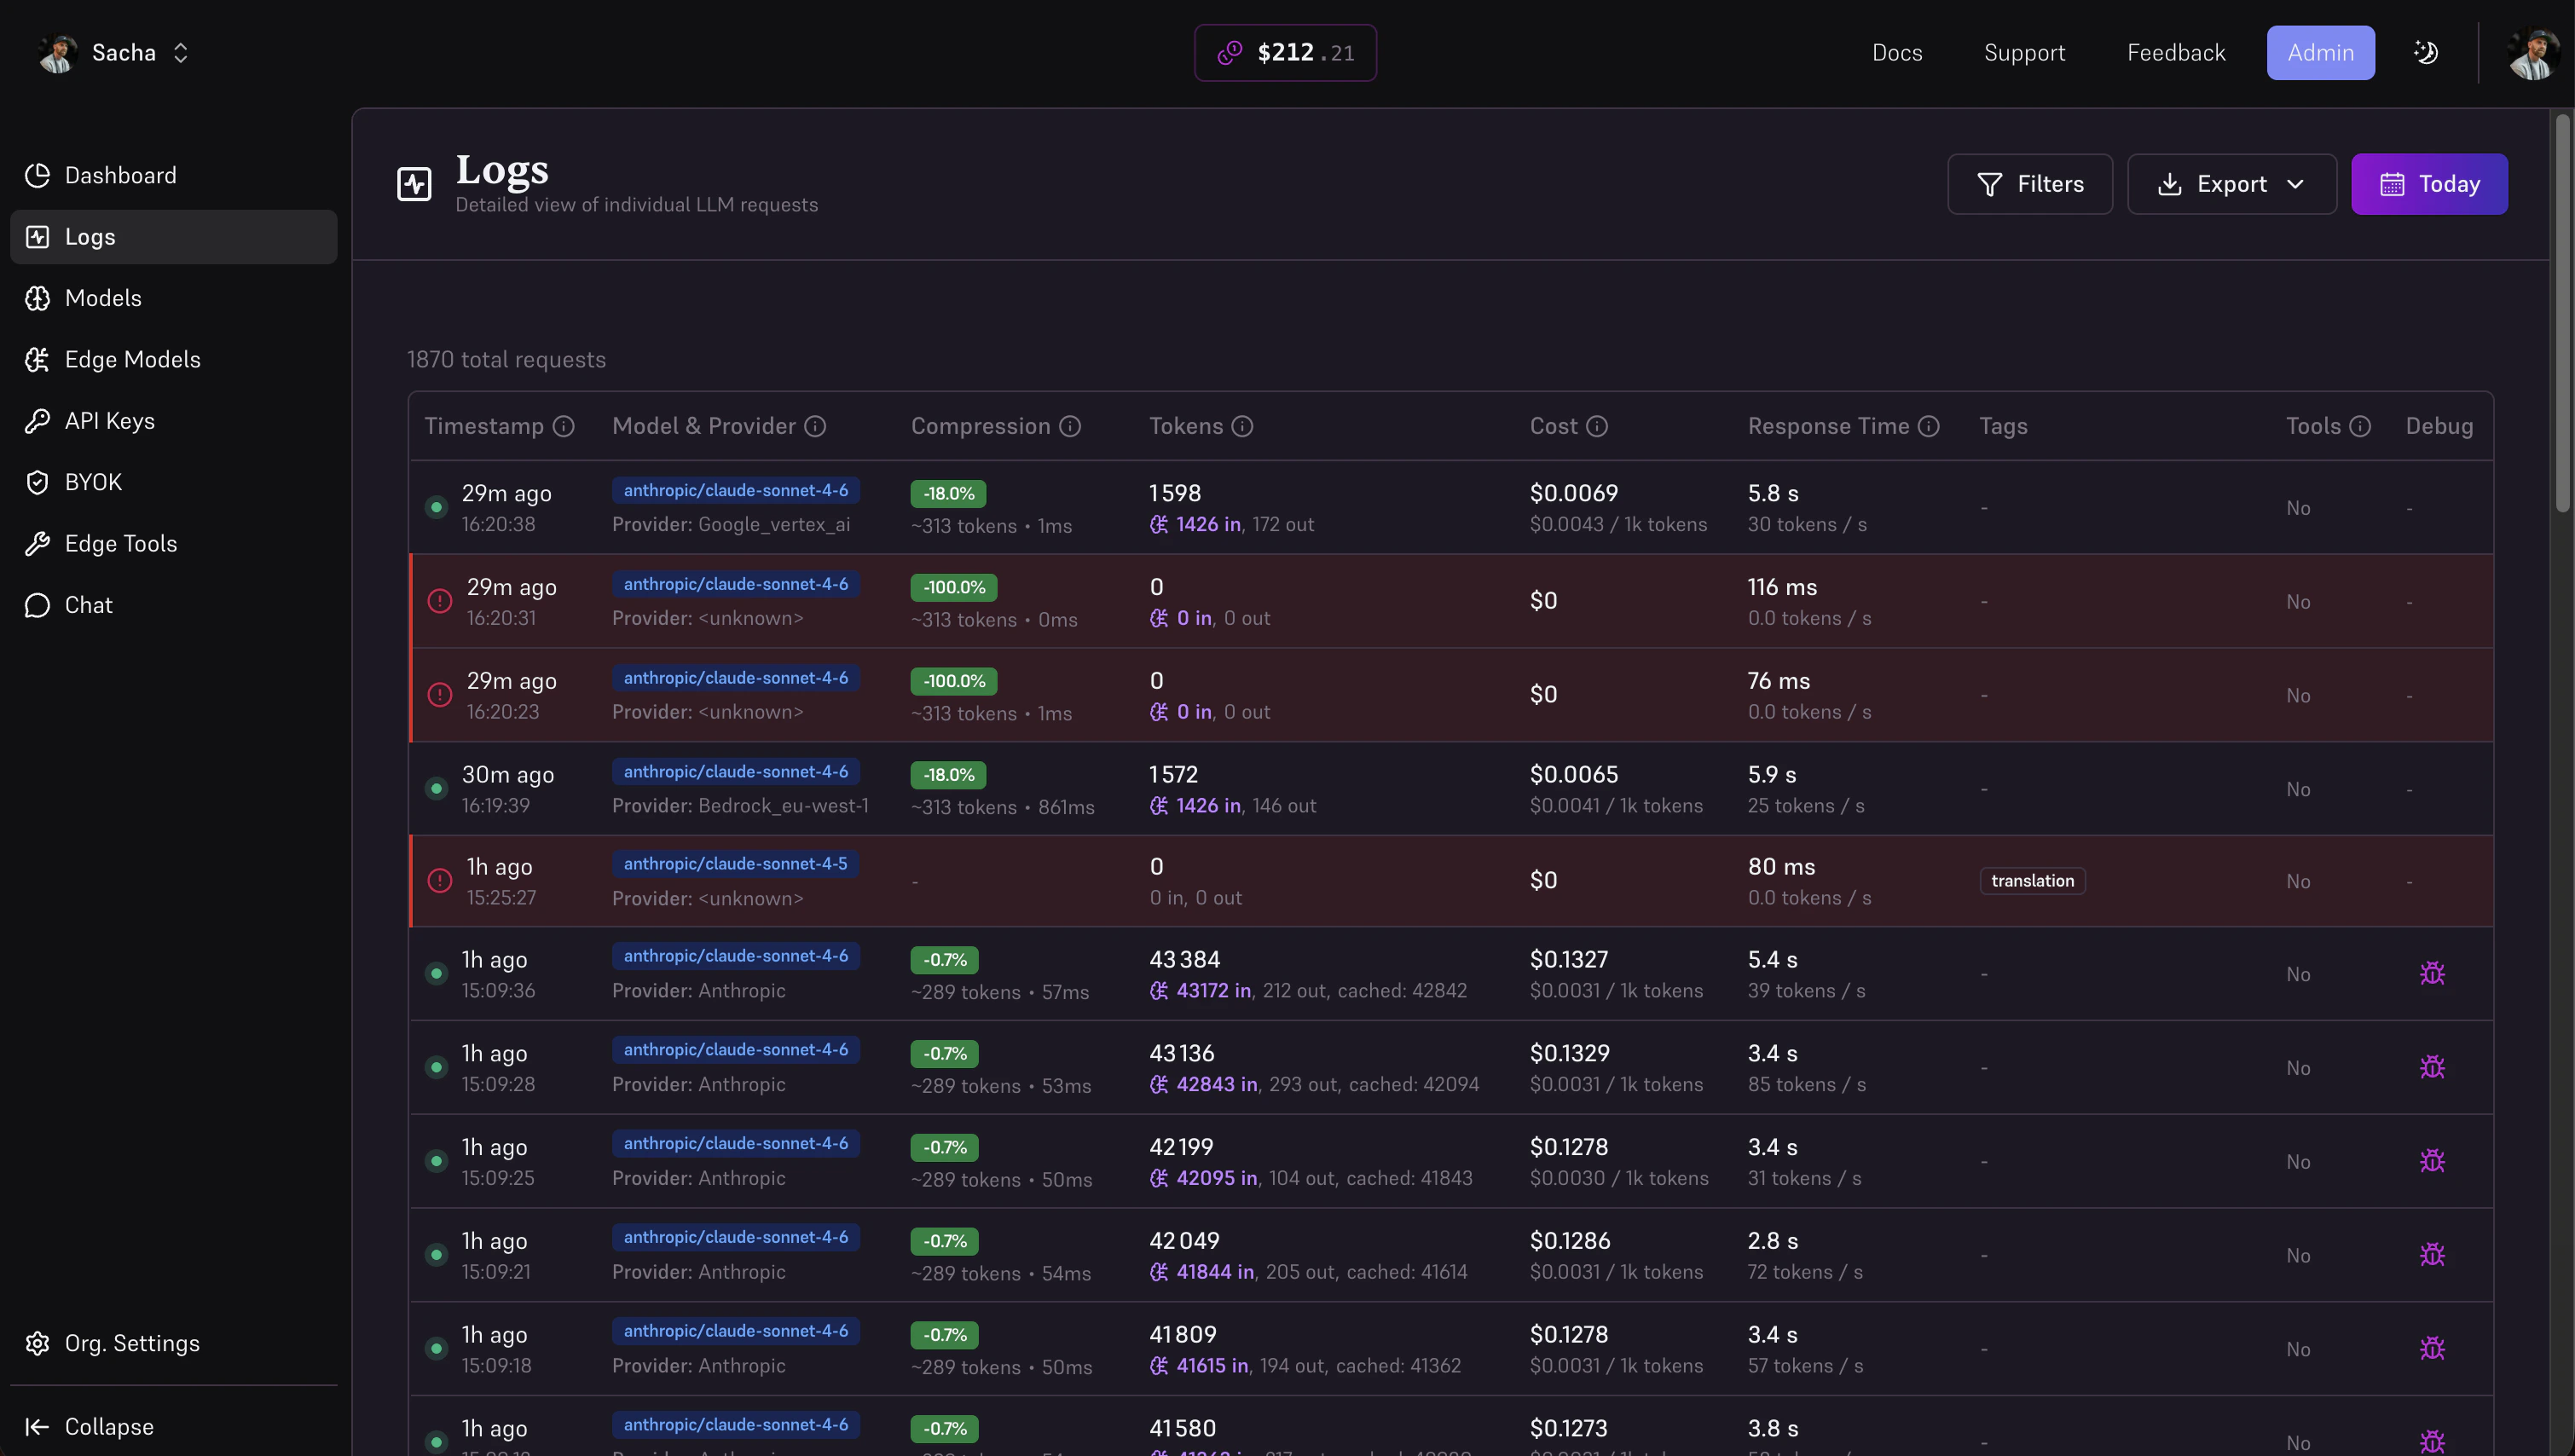
Logs
The Logs page lists every request — model, provider, tokens, cost, compression delta, latency, errors. Click into a row to inspect the full request and response payload (when Debug mode is enabled on that key).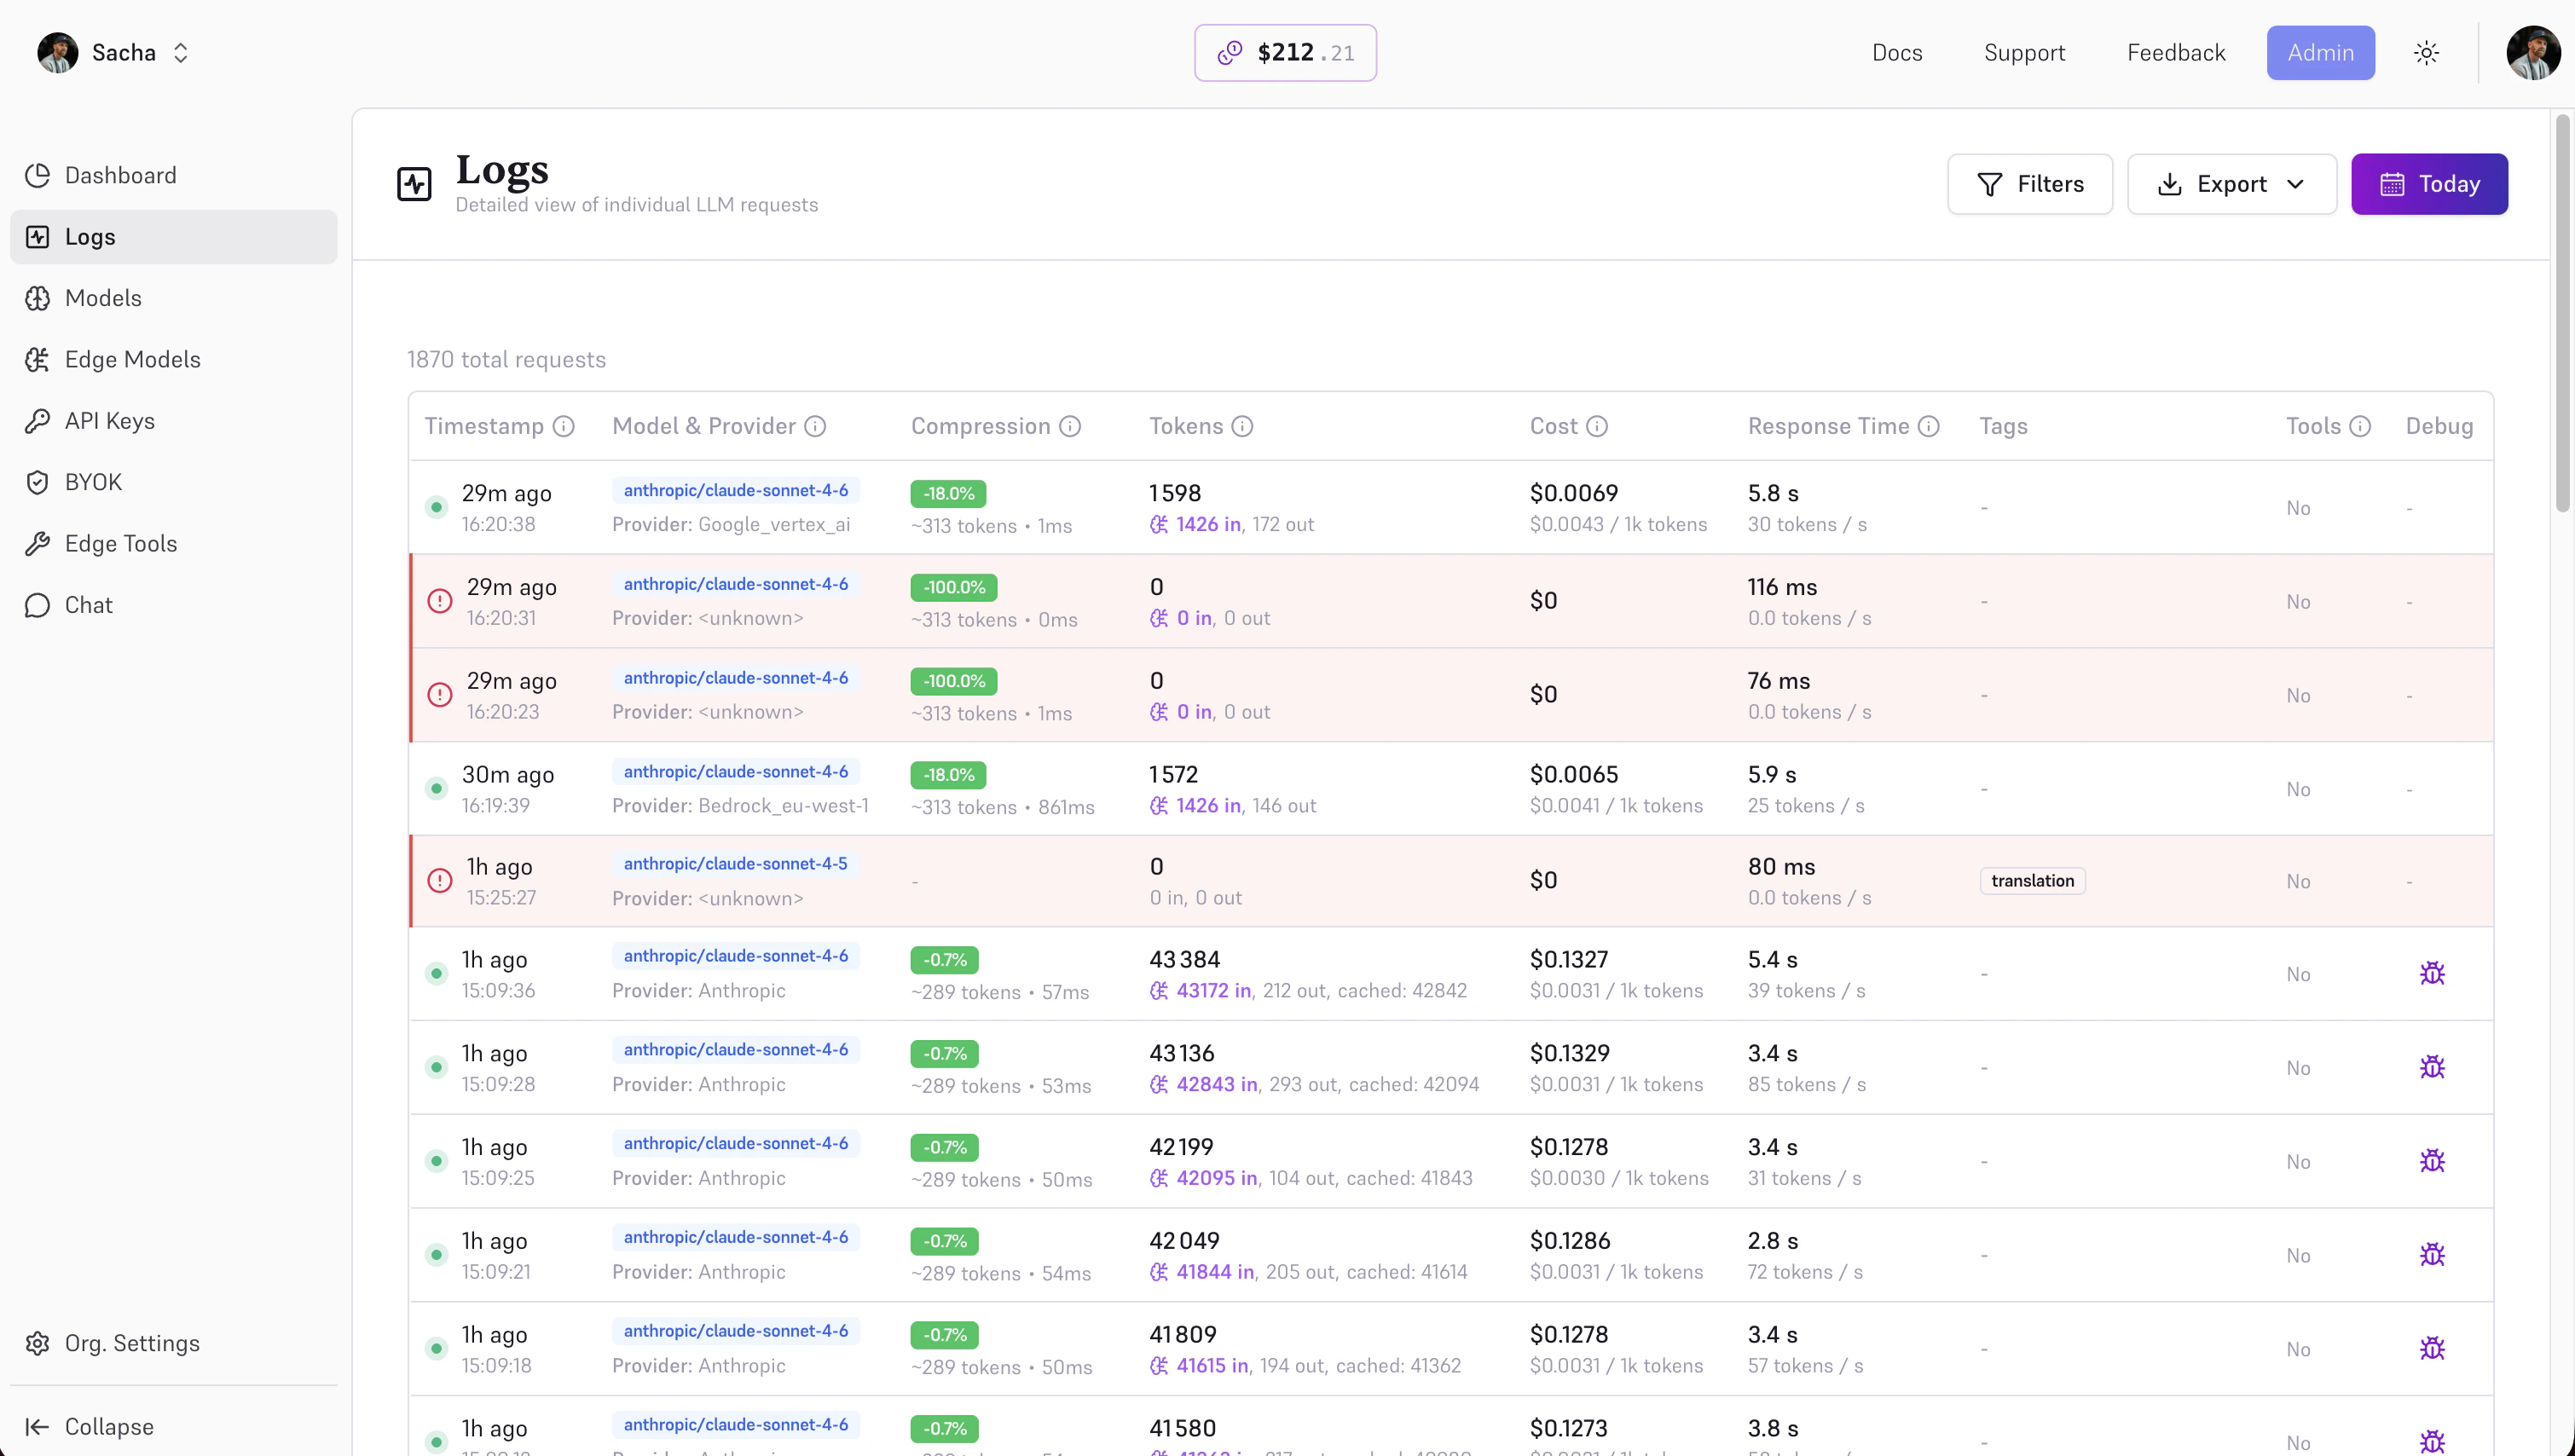
With our SDKs
Token Usage Tracking
Every Edgee response includes detailed token usage information for tracking and cost analysis:- Model (GPT-5.2 vs Claude vs Gemini)
- Project or application
- Environment (production vs staging)
- User or tenant (for multi-tenant apps)
- Time period (daily, weekly, monthly)
Use token usage data with provider pricing to calculate costs. The Edgee dashboard automatically calculates costs based on real-time provider pricing.
Request Tags for Analytics
Tags allow you to categorize and label requests for filtering and grouping in your analytics dashboard. Add tags to track requests by environment, feature, user, team, or any custom dimension. Using tags in native SDKs:- TypeScript
- Python
- Go
- Rust
x-edgee-tags header (comma-separated):
- OpenAI SDK (TypeScript)
- Anthropic SDK (Python)
Environment taggingTag by environment:
production, staging, developmentFeature taggingTag by feature:
chat, summarization, code-generation, rag-qaUser/tenant taggingTrack per-user or per-tenant usage:
user-123, tenant-acme, customer-xyzTeam taggingOrganize by team:
team-backend, team-frontend, team-data